No, not yet.

I haven’t been this hyped about something new in the industry since WebRTC first landed (and we all know what an emotional rollercoaster that has been). It’s not production-ready. But we’re talking about it anyway.
What is it?
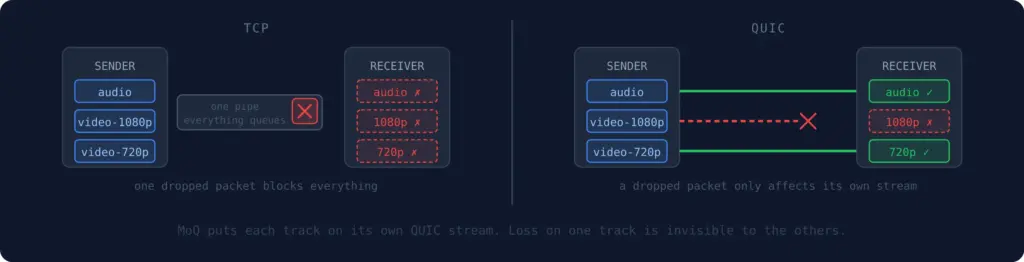
MoQ is a live media protocol built on QUIC – the same transport underneath HTTP/3. QUIC runs over UDP but adds per-stream reliability and multiplexing: a dropped packet on one stream doesn’t stall the others. That’s the structural fix for TCP’s head-of-line blocking problem, which has quietly haunted live streaming for a long time.
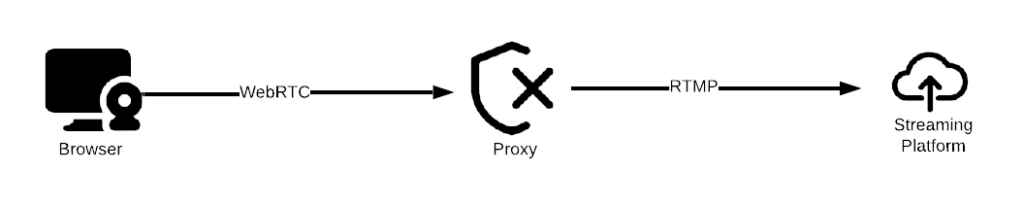
On top of QUIC, MoQ adds a publish/subscribe model. Publishers announce named tracks: video-1080p, audio-english, captions-fr, and subscribers ask for the ones they want. A relay sits in the middle, caches what’s flowing, and fans it out to whoever subscribed. The relay doesn’t need to understand the payload. It routes on headers alone, which means end-to-end encryption doesn’t break anything.
In the browser, MoQ runs over WebTransport – the browser API that exposes QUIC to web apps.
Why now?
For a while, MoQ was an interesting spec and not much else. The IETF working group was moving, engineers at Google, Cloudflare, Akamai and others were contributing, but there was nothing real to point at.
That changed. Cloudflare launched a live MoQ relay network, available today, public test endpoint and all. At NAB 2026, eleven vendors showed up with working implementations and demonstrated cross-vendor interop: Bitmovin, Meta, Oracle, Meetecho, all talking to each other. And in March 2026, Safari shipped WebTransport without flags. That last one quietly removed the biggest blocker to browser-based MoQ – roughly a billion iOS devices that simply couldn’t participate before.
None of this means it’s ready. But the gap between “interesting spec” and “thing you can actually run” closed meaningfully in the last six months.
The part worth stealing, no data waste
Almost every live protocol you’re using today is push-based. RTMP, SRT, RTSP, WebRTC: the publisher decides what flows and pushes it whether anyone’s watching or not. You open a stream to a server and data starts moving. That’s just how it works.
MoQ flips this. Nothing flows until someone subscribes. The relay won’t forward a track until a downstream client asks for it. If nobody’s watching camera 7, camera 7’s data goes nowhere.
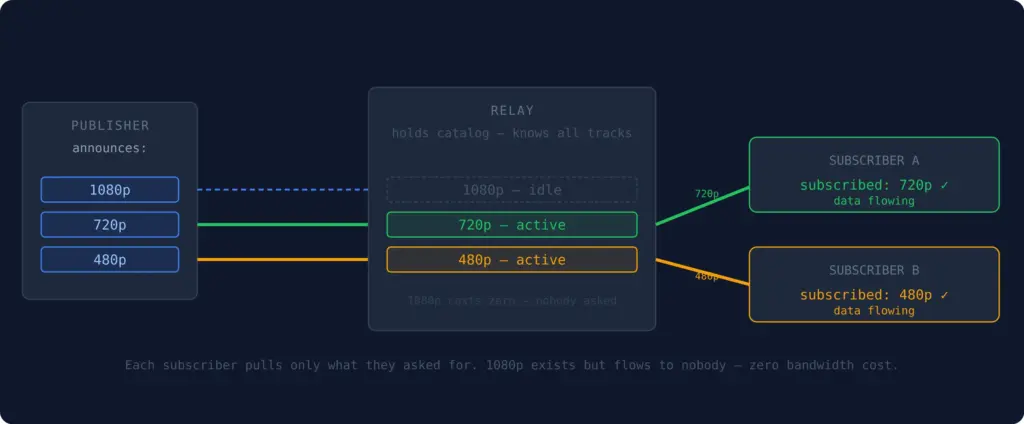
Think about what that means in practice. A 9-camera setup over an expensive starlink connection (a real MoQ use case, not a hypothetical) only pays bandwidth for the cameras someone is actually watching. ABR becomes subscribe to video-720p, unsubscribe, resubscribe to video-1080p when conditions improve. No playlist polling, no segment requests, just a subscription swap. And if you want redundancy across multiple CDN relays, you publish once and connect to all of them. Nothing flows from any of them until a viewer shows up.
The relay also knows what matters. QUIC lets you attach priorities to streams, so under congestion the relay drops the least important tracks first. Audio survives. The primary camera survives. The rest degrades gracefully rather than everything buffering at once.
And honestly, I’m flabbergasted this wasn’t always how it worked. Not pushing data nobody’s watching is common sense. But until now it wasn’t built into the protocol. Some implements hacked around it: CDN origin-pull configs, application logic to kill RTMP streams at zero viewers, manifest tricks. All solving at the application layer what MoQ just handles natively.
Where does it fit?
MoQ doesn’t slot neatly into one part of the stack. It’s gunning for all of it. Ingest, delivery, and low-latency playback. That’s either ambitious or reckless, depending on how the tooling matures.
vs. RTMP
RTMP runs over TCP. TCP retransmits all lost packets before moving on, and on a flaky connection a momentary hiccup turns into a freeze. MoQ runs over QUIC, where each track is an independent stream. A bad packet on one track doesn’t stall the others. The stream skips the stale frame and keeps going.
vs. SRT
SRT handles unreliable networks well: UDP, retransmission, a latency deadline after which stale packets are dropped. The limitation is that it’s a single stream, so under congestion, audio and video queue together and suffer equally. MoQ runs multiple independent streams with priority per track. QUIC’s congestion controller starves lower-priority tracks first, so the important stuff keeps flowing.
vs. WebRTC
Same latency target, very different scaling model. WebRTC is still the right answer for anything sub-300ms and interactive: conferencing, bidirectional, real-time. It has years of production deployment and universal browser support. MoQ can hit sub-second latency too, but its relay fanout model means it scales like a CDN rather than requiring a session per viewer. At broadcast scale, that matters. At ten viewers, it doesn’t.
vs. HLS
MoQ replaces segment polling with subscriptions. Instead of a player hitting a CDN every few seconds for new segments, it subscribes to a track and receives data as it’s published. Lower latency, less overhead. The gap today: HLS works everywhere, on every device, with every CDN. MoQ works in controlled environments with specific infrastructure. Not a swap you make tomorrow.
Let’s play with it
The simple demo sends your camera feed to the public moq.dev relay and plays it back to measure latency. Open it, allow camera access, hit Start on both boxes, and notice the latency number, also the time-to-first-frame (TTFF).
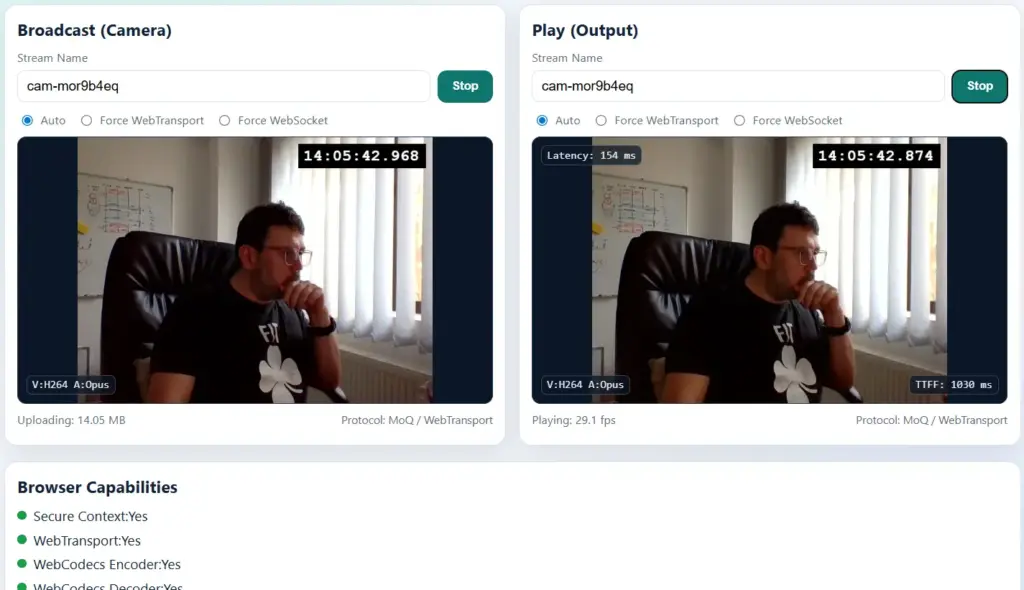
…Then play some more:
- Notice (almost) no traffic is wasted when nobody is watching
- Force WebTransport or WebSocket mode and compare the latency difference, (also TTFF) on each.
- Open the play side on your phone while broadcasting from desktop (or the other way around); switch networks mid-stream and watch it recover.
- Further hack with it, source is here
- Play with the other demos
Worth noting while we’re here:
- QUIC identifies connections by connection ID, not IP:port. Switch from WiFi to 4G mid-stream and the connection keeps going from where it left off.
- The moq.dev client races a QUIC connection against a WebSocket fallback simultaneously — if QUIC fails, WebSocket picks it up transparently.
Why not yet?
The spec is at draft-17 and still moving. Implementations at different draft versions don’t always speak to each other: “supports MoQ” can mean anything from a Cloudflare preview to a custom vendor fork that diverged at draft-07. That’s not a warning sign, it’s just where the standard is.
Encoder support is the bigger gap. OBS has a community plugin. Hardware encoders have nothing. If your workflow starts with a camera and a box, MoQ isn’t an option yet. RTMP and SRT still own that first mile completely.
Outside of Cloudflare’s relay and the moq.dev reference implementation, the tooling is thin. The Bitmovin player works. MediaMTX has early support. Everything else is experimental, version-locked, or both. You can run a demo. You can’t run a production stream.
The TLS situation is also annoying. QUIC requires TLS 1.3, traditional load balancers don’t support it, and managing your own certificates for a live streaming stack is friction nobody needs right now.
None of this is fatal. We’re just not there yet.
Why bother then?
The moq.dev project is one engineer who quit his job to work on this full time and built a complete conferencing app just to prove the protocol works in practice. The spec gets shaped by real applications, not by committee imagination. That’s rarer than it sounds, and it shows in how clean the design is.
Speaking of clean: RTMP was designed in 1996. WebRTC carries the weight of Google’s internal video infrastructure. HLS is a segment-polling workaround that became a standard. MoQ was designed knowing all of that existed and choosing not to repeat any of it.
It also connects faster than anything you’re probably using. RTMP needs a TCP handshake plus its own multi-step exchange before a single byte of media flows, around 3 roundtrips minimum. WebRTC is worse: ICE, DTLS, SDP negotiation can run to 10+ depending on NAT. HLS fetches a manifest, then fetches segments, then keeps polling forever. MoQ over QUIC combines the transport and TLS handshake into 1 roundtrip. On reconnect, 0-RTT means the session resumes before the server has even responded.
There’s more, hardcore nerds only
The relay is genuinely dumb, by design. It routes on headers and never touches the payload. End-to-end encryption works trivially because the relay has nothing to decrypt. You can put anything in a track – video, audio, robot telemetry, boat sensor data – and the infrastructure doesn’t care.
The catalog is a JSON file served as just another track. No SDP, no special signaling, no negotiation ceremony. A publisher writes what’s available, a subscriber reads it and asks for what it wants. Fucking brilliant, spread the word.
When a relay drops an object under congestion, it doesn’t just go silent. It sends a signal to subscribers: “this object was skipped.” The player knows exactly what it missed and can react intelligently rather than just stalling.
Video groups in MoQ align to keyframes. A relay caches the last complete group, so a new viewer joining mid-stream gets a clean start immediately from cache, without waiting for the next keyframe from the publisher 😀 I rest my case.